Merge data from handheld scanner and terrestrial laser scanner

TitleWarum einen terrestrischen und handgeführten 3D-Scanner kombinieren?
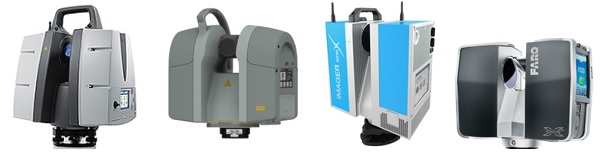
Jeder, der schon mit einem terrestrischen Laserscanner gearbeitet hat, kennt die unterschiedlichen Herausforderungen dabei. Es gibt immer wieder Bereiche, die Sie mit einem terrestrischen Laserscanner, wie zum Beispiel von Leica, Trimble, Z+F und FARO, auf Grund der Größe oder Erreichbarkeit des Messobjekts oder aus Zeitmangel nicht erfassen können.
Why should you combine a terrestrial and a handheld 3D scanner?
Everyone, who has already worked with a terrestrial laser scanner, knows the different challenges. You always have some areas that cannot be captured with a terrestrial laser scanner (such as Leica, Trimble, Z+F or FARO scanner) in consequence of size or limited accessibility of the object to be scanned or for lack of time.
There are two options for scanning these missing areas: The first option is to scan the areas from additional positions. But you often need many positions - this circumstance causes much more work and cannot be realized technically everytime.
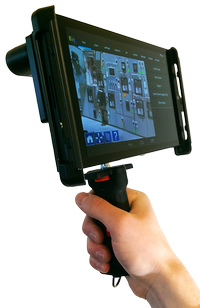
The second option is to capture the areas by means of a handheld 3D scanner, such as DPI-8 from DotProduct LLC, and to merge both scanner data sets together in a software (e.g. FARO Scene) afterwards.
Scan procedure using the example of FARO Focus3D and DotProduct DPI-8
The approach for scanning is as follows: We scan the spacious areas by means of a FARO laser scanner using laser scanning targets such as reference spheres or checkerboard targets. To quickly combine data from handheld scanner and terrestrial scanner later, we position three targets - in the best case - in corners or hidden areas that cannot be captured.
During or after scanning process with the terrestrial scanner, we can start capturing with the handheld scanner DPI-8. The scanner needs some minutes to warm-up itself and the sensors. Since there will be no influences of temperature during further operation, significantly precise data will be captured.
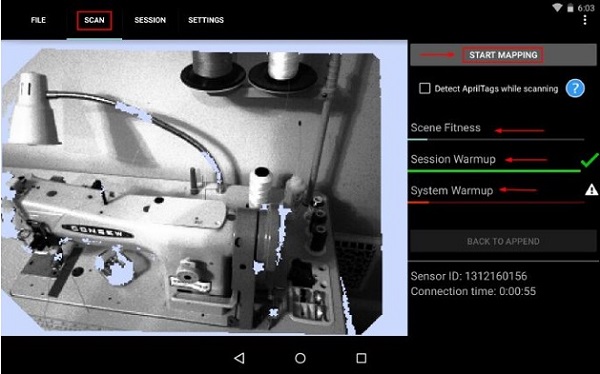
AprilTags for more precise scan results during use of DPI-8
Depending on the size of the area to be captured, the use of additional targets for the handheld scanner DPI-8 might be required. We recommend AprilTags (available for free) offered by DotProduct. The scanning software, which runs directly on the tablet PC, is called Phi.3D. Phi.3D software detects AprilTags automatically during the scanning process.

AprilTags are coded 2D targets allowing a clear assignment. After scanning with DPI-8, the scans are automatically registered and can immediately be used on the tablet PC. We can navigate through the scans and already take measurements. Moreover we recommend to define the coordinate system since we can position the point cloud more clearly within the CAD system. However if the point cloud is aligned to an existing model, we can ignore this step.

Registration of FARO and DPI-8 scans
For registration of DPI-8 scans together with FARO scans in Scene, there is no need to define the coordinate system. We export the scans in *.pts format - consisting of x value, y value, z value and reflection value. We rename this file *.xyz. Then, we can import the registered DPI-8 data via "drag & drop" into an existing FARO Scene project.
Now, the scans from FARO and DPI-8 scanner can be merged in FARO Scene using the various registration tools.
Export of scan data for post-processing
After having merged all data, we can export the point clouds for use in our desired CAD software such as AutoCAD, Revit, Rhino or MicroStation. Furthermore, we can directly measure in FARO Scene 5.5 and navigate through the point cloud.
Combining two different measurement methods allows us to capture all areas in an economically advantageous way. Although we use two scanners, we can work just in one processing software. That means there is no need for further trainings and we can process projects as usual.
TitleScan-Ablauf am Beispiel von FARO Focus3D und DotProduct DPI-8
Die Vorgehensweise bei der Erfassung ist wie folgt: Wir scannen die weiträumigen Bereiche beispielsweise mit einem FARO-Laserscanner unter Verwendung von Zielmarken (Targets) wie Referenzkugeln oder Schachbrettzielmarken. In den verwinkelten Ecken oder verdeckten Bereiche, die nicht erfasst werden können, platzieren wir im optimalen Fall drei Zielmarken, um die Verknüpfung zwischen den Daten des Handscanners und den Daten des terrestrischen Scanners im Anschluss schnell herstellen zu können.
Während des Scan-Vorgangs oder im Anschluss können wir die Aufnahme mit dem Handscanner DPI-8 starten. Der Scanner benötigt ein paar Minuten, um sich und die Sensoren aufzuwärmen. Da es keine Temperatureinflüsse im weiteren Betrieb gibt, werden wesentlich präzisere Daten erfasst.
TitleAprilTags für genauere Scan-Ergebnisse mit dem DPI-8
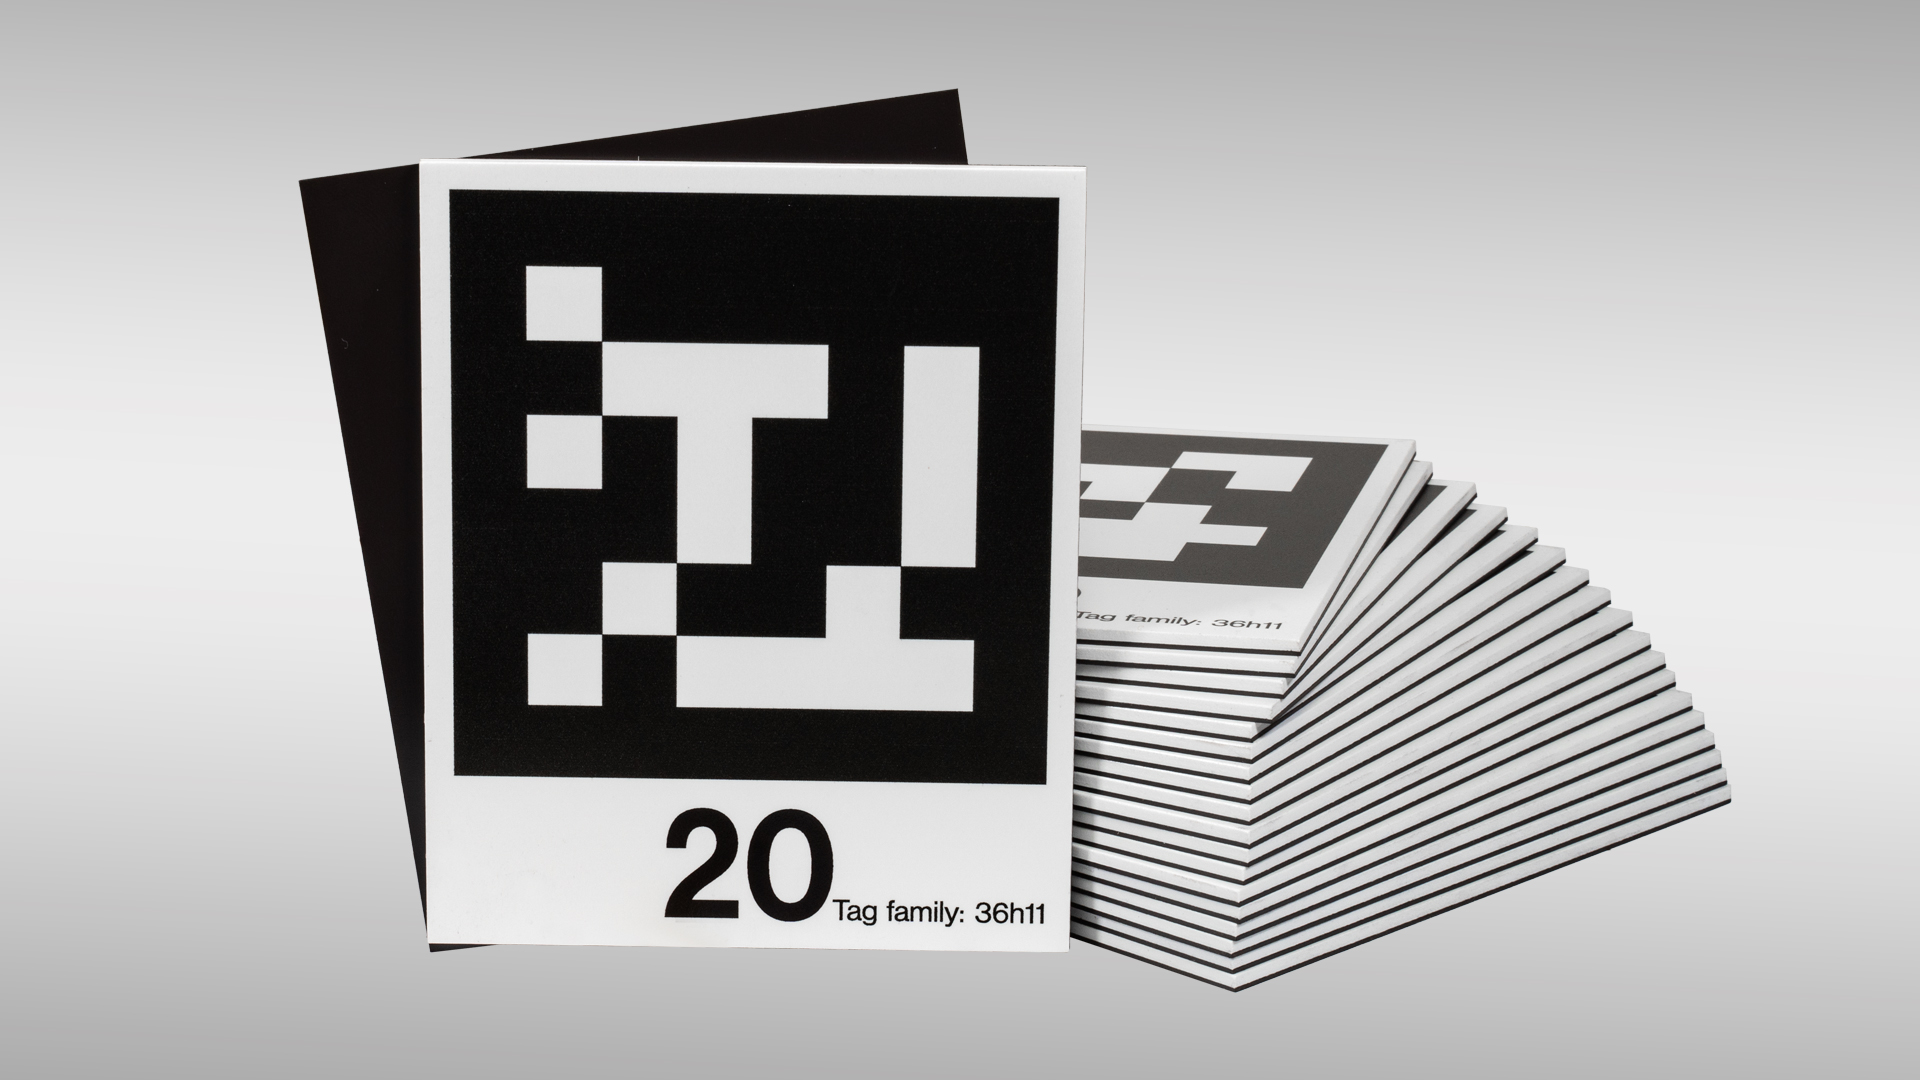
Je nach Größe des zu erfassenden Raumes kann es nötig sein, weitere Targets für den handgeführten Scanner DPI-8 anzubringen. Für den DPI-8 empfehlen wir die kostenlosen AprilTags von DotProduct. Die Software zum Scanner, welche direkt auf dem Tablet läuft, heißt Phi.3D. Die Phi.3D-Software erkennt die AprilTags automatisch während des Scanvorgangs.
AprilTags sind codierte 2D-Marken, die eine eindeutige Zuordnung ermöglichen. Nach dem Scannen mit dem DPI-8 werden die Scans automatisch stationiert und können sofort auf dem Tablet genutzt werden. Wir können uns dann in den Scans bewegen und bereits Messungen vornehmen. Außerdem empfehlen wir, das Koordinatensystem festzulegen, da somit die Positionierung der Punktwolke ins CAD-System eindeutiger ist. Wird die Punktwolke allerdings auf ein vorhandenes Modell ausgerichtet, kann dieser Schritt vernachlässigt werden.
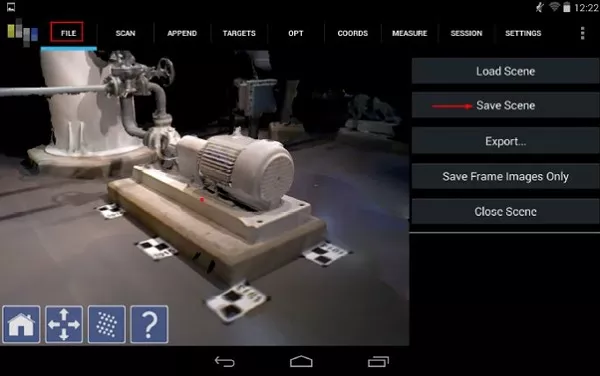
Stationierung von FARO und DPI-8 Scans
Für die Stationierung mit den FARO Scans in Scene ist die Festlegung des Koordinatensystems nicht notwendig. Wir exportieren die Scans im Format *.pts - mit dem Aufbau in x-Wert, y-Wert, z-Wert und Reflexionswert. Diese Datei benennen wir dann in die Endung *.xyz um. Danach können wir die registrierten Handscanner-Daten über "Drag&Drop" in ein vorhandenes FARO Scene Projekt importieren.
Die Scans vom FARO-Scanner als auch vom DPI-8 können jetzt über die verschiedenen Stationierungstools in Scene zusammengerechnet werden.
Es gibt verschiedene Möglichkeiten Scans in FARO Scene der Version 5 zu stationieren. Dazu gibt es einen weiteren Beitrag unter:
Export der Scandaten für die Weiterverarbeitung
Nachdem wir alle Daten miteinander verknüpft haben, können wir die Punktwolken für die Weiterverwendung in unserer gewünschten CAD-Software wie z. B. AutoCAD, Revit, Rhino oder MicroStation exportieren oder auch direkt in FARO Scene 5.5 messen und uns durch die Punktwolke bewegen.
Durch die Kombination zweier unterschiedlicher Messverfahren können wir wirtschaftlich alle Bereiche erfassen. Trotz der Verwendung von zwei Scannern können wir in nur einer Auswertesoftware arbeiten, wodurch keine weiteren Schulungen erforderlich sind und die Projekte wie gewohnt bearbeitet werden können.